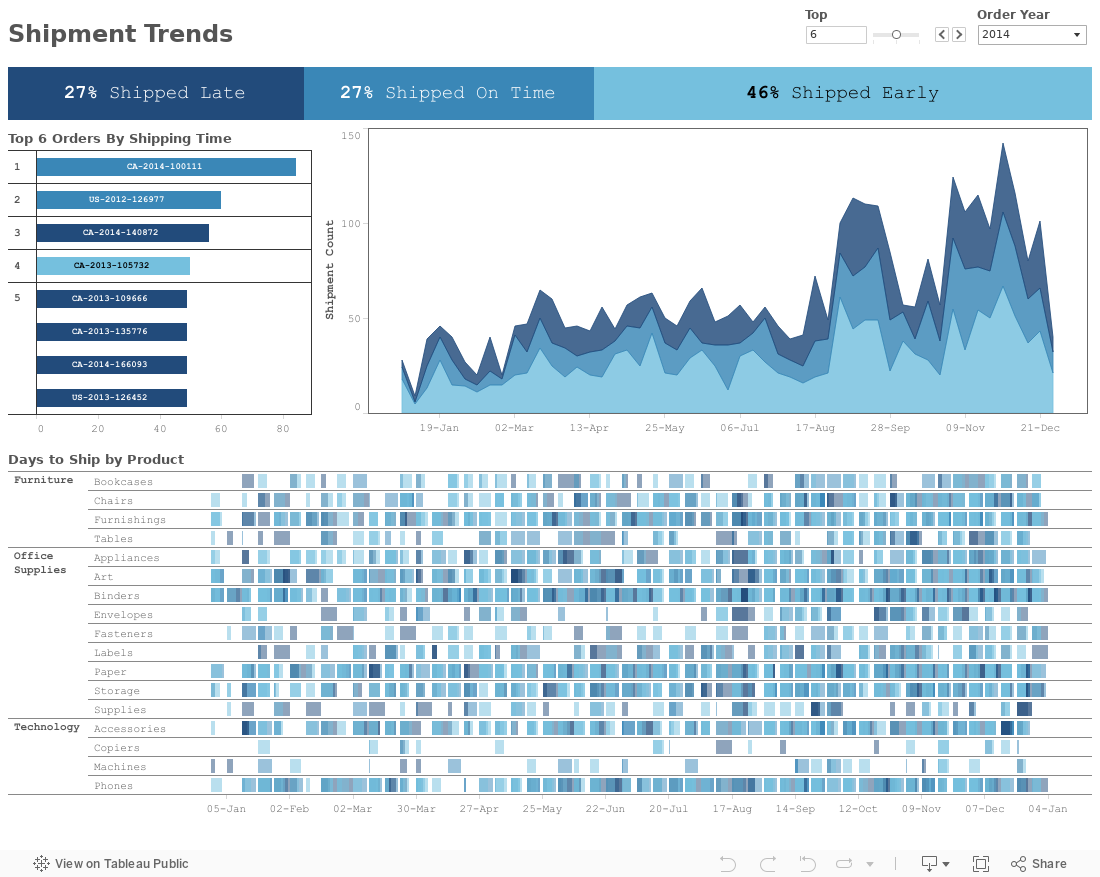
The embedded Tableau Report focusing on the following features:
1. Gantt chart for displaying a duration viz over time scale
2. Area chart to viz metrics over time scale with calculated dimension on Color pill to call out if the order was shipped in time
3. A Bar chart for the rank by Shipping time at the Order ID granularity
The report is interactive by means of the following:
a. A year picker drop-down (parameter)
b. A Top N variable (slider parameter)
c. Dashboard Action filters
Comments
Post a Comment