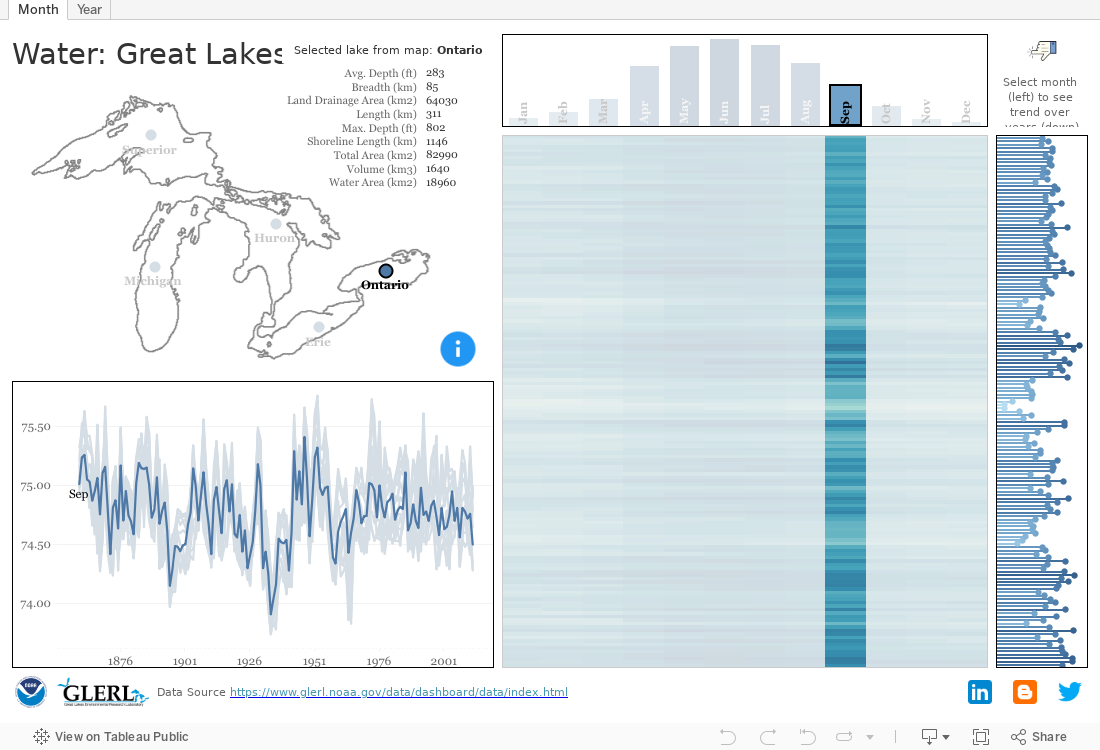
Friends, built this Viz on top of Great Lakes water data from NOAA site. The submission has been made for round 3 of the IronViz feeder contest leading to #TC18. This Viz is published to Tableau Public and embedded to this blog
Thanks for sharing valuable information. Your blogs were helpful to tableau learners. I request to update the blog through step-by-step. Also, find the tableau news at Tableau Online Training Blog.
Created a Tableau Viz using the OOTB Data Set to do a Yea over Year metric comparison, where the two years to be compared are user interactive choice. Incorporates the following features: 1. Trend Charts YoY using color marks at a Monthly granularity 2. Box and Whisker Viz with YoY using color marks at a Monthly granularity 3. Trend and 4. Histogram YoY using color
The Published report presents an analysis of Flight Delay focussing on the following features of Tableau: 1. Heat maps 2. Geo Maps colored by type of delay 3. Dual Axis Trend The user-interactive report has been published to Tableau Public and embedded below:
Thanks for sharing valuable information. Your blogs were helpful to tableau learners. I
ReplyDeleterequest to update the blog through step-by-step. Also, find the tableau news at
Tableau Online Training Blog.